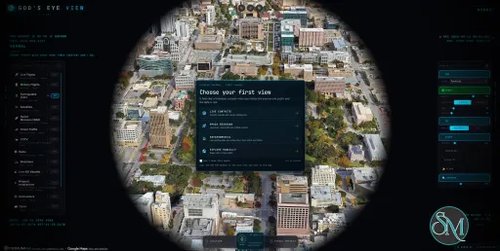

God's Eye View is an open-source geospatial visualization application that combines public data feeds with a photorealistic 3D globe. Built around CesiumJS and vanilla JavaScript, it brings aircraft, ships, satellites, earthquakes, weather, and public camera locations into a single interactive interface.
The application is designed for people interested in geospatial data, open-source intelligence (OSINT), geographic exploration, and real-time situational awareness. Users can track objects, inspect available metadata, change the globe's visual appearance, and interact with the interface using voice commands.
Unlike a conventional mapping application, God's Eye View emphasizes combining multiple public information sources into one exploration and visualization environment. However, not every displayed element represents a live observation, and the accuracy of individual layers depends on the underlying data source.
Features
Interactive 3D Globe
God's Eye View uses a 3D globe to visualize geographic information at global and local scales. Users can navigate between regions, zoom in on tracked objects, and inspect available information without switching between separate tracking websites.
Its photorealistic imagery and terrain make the application useful for geographic exploration and demonstrations, while its modular architecture allows individual data layers to be extended independently.
Live Aircraft, Ships, and Satellites
The application combines multiple tracking sources to display aircraft, maritime traffic, and satellites. Users can select tracked objects, inspect their available metadata, and follow their movement across the globe.
Additional tracking features include a nearby-contacts view and a cockpit-style camera mode that follows selected aircraft. Satellite pass predictions can also provide estimated rise, peak, and set times for loaded satellites.
These capabilities depend on the availability and freshness of the relevant data feeds. They should not be interpreted as unrestricted access to every aircraft, vessel, or satellite.
Earthquakes, Weather, and Environmental Data
Beyond transportation and satellite tracking, God's Eye View includes environmental layers for earthquakes and weather.
Its documented weather features include forecast wind visualization, observed radar playback, satellite cloud imagery, lightning, and tropical cyclone tracks. These layers help users explore changing environmental conditions alongside other geographic information.
The application combines data from multiple sources, so update frequency, geographic coverage, and accuracy can differ between layers.
Public Camera Locations
The application can display public camera locations, including mapped automatic license plate recognition (ALPR) camera locations sourced from OpenStreetMap.
Camera positions and metadata should be distinguished from live video availability. The presence of a mapped camera does not necessarily mean that its footage is accessible, current, or available for viewing.
AI-Powered Voice Control
God's Eye View supports hands-free interaction through a real-time AI agent. Users can issue voice commands to navigate the globe, inspect tracked objects, and query supported data layers.
Its analyst-style answers can help count, filter, and rank supported objects or geographic features. The application also includes voice-driven annotations, allowing users to add marks, boundaries, and routes to the globe.
AI capabilities depend on the configured provider and available credentials. The basic application can start without optional API keys, but some enhanced features require additional setup.
Tracking, Visualization, and Camera Controls
The interface includes tools for following selected objects, displaying movement trails, and showing contextual metadata. Other features include:
Detection overlays: Display bounding boxes and identifiers over objects in view.
Visual styles: Apply shader-based effects such as thermal, night-vision, monochrome, and CRT-inspired appearances.
Military-style HUD: Present selected information in a tactical interface.
Scene director: Create cinematic camera movements for demonstrations and recordings.
Shareable links: Preserve selected camera positions, visual styles, layers, and tracking context in a URL.
These features make the application useful not only for data exploration but also for presentations, educational demonstrations, and geospatial visualization projects.
Download God's Eye View v0.2.1 - Software Mirrors |
|---|
God's Eye View v0.2.1 Source Code |
God's Eye View v0.2.1 Release Notes:v0.2.1 hardens the local server and the MCP panel, shrinks the build, and refines the Cyber HUD. It also catches up on everything new since v0.1.1 that the first v0.2.0 notes left out. Security
Behavior change: hostnames ending in Other changes
Also new since v0.1.1The first v0.2.0 notes missed much of what shipped; they are now complete. The highlights:
CommunityThank you to the people behind this release's fixes:
Everyone who contributed to v0.2.0 is credited, with what they built, in the v0.2.0 notes. Verification
Existing Pinokio installs can choose Update; terminal installs can run |
Performance and Compatibility
God's Eye View runs locally and presents its interface in a web browser. Its frontend uses CesiumJS and Vite, while local server components provide access to data sources and optional AI services.
The project supports installation through Pinokio or a terminal-based development workflow. It is available for Windows, macOS, and Linux through the documented Pinokio installation path. Developers can also run it directly from the repository with Node.js.
The application can start without optional API keys by using its default imagery and terrain sources. Additional providers, including Google Maps and Cesium ion integrations, can improve the available imagery, terrain, and place-search capabilities when configured.
Performance depends on browser WebGL support, graphics hardware, the size of the visible scene, network connectivity, and the data layers enabled. A detailed 3D globe with multiple live data sources can demand more resources than a basic two-dimensional map.
An important limitation is that the interface combines different kinds of information. Some sources are live or periodically refreshed, while traffic may be simulated using aggregate location data and certain camera positions or launch trajectories are estimates. Users should check source details before treating a visualization as authoritative intelligence.
System Requirements
The project does not specify a single minimum CPU, RAM, or GPU configuration. The following requirements are based on its documented installation and architecture.
Operating system: Windows, macOS, or Linux through the supported installation workflow.
Runtime: Node.js 24.14 or later within the supported Node.js 24 or 26 release lines for terminal installation.
Browser: A modern browser with WebGL support.
Graphics: A GPU capable of handling interactive 3D globe rendering is recommended.
Internet connection: Required for external map imagery and most live data feeds.
API keys: Not required for the basic installation. Optional provider credentials unlock additional imagery, place search, vessel tracking, and AI voice capabilities, depending on the provider.
Installation options: Pinokio or a local Node.js development environment.
The application can be started without API keys using its default imagery and terrain sources. However, photorealistic 3D imagery and some enhanced features require additional configuration. (GitHub repository, contribution guide)
Pros and Cons
Pros
Combines aircraft, ships, satellites, earthquakes, weather, and other geographic data in one interface.
Provides an interactive 3D globe with detailed imagery and terrain options.
Includes AI-powered voice control and natural-language queries.
Offers tracking, object metadata, visual effects, and camera-following modes.
Can run locally without mandatory API keys.
Open-source code allows developers to inspect, customize, and extend the application.
Supports Windows, macOS, and Linux through Pinokio.
Uses a modular architecture that makes adding data layers more manageable.
Cons
Requires a capable browser and graphics hardware for a smooth 3D experience.
Depends on external data providers, whose availability, accuracy, and update frequency can vary.
Some enhanced features require API keys and may be subject to provider quotas or usage charges.
Voice interaction requires additional AI configuration.
Some displayed information is simulated or estimated rather than directly observed.
The number of features and configuration options can overwhelm first-time users.
It is primarily a visualization and exploration tool, not a replacement for authoritative intelligence or specialized GIS software.
How to Install
Option 1: Install with Pinokio
Pinokio provides the simplest installation path for users who do not want to manage Node.js dependencies manually.
Install or update Pinokio to a supported version.
Open the God's Eye View repository and follow its linked Pinokio installation instructions.
Click Install, then start the application.
Open the local address provided by the launcher.
Explore the globe using the default data sources.
Configure optional provider credentials through the application's settings if you need additional capabilities.
Option 2: Install from the Source Code
For developers who prefer a terminal-based installation, ensure that a supported Node.js release is installed first.
Clone the repository and install its dependencies:
git clone https://github.com/bilawalsidhu/gods-eye-view.git
cd gods-eye-view
npm ci
npm run doctor
npm run dev
Open the local address shown by the application, typically:
http://localhost:4173The setup doctor checks the local environment and helps identify configuration issues. You can start without optional API keys, then add credentials for enhanced functionality.
For a production build or development work, follow the project's current README and contribution guide, since the development server and preview server have different purposes.
Final Verdict
God's Eye View is an impressive open-source geospatial application that brings multiple public data sources together in a visually engaging 3D environment. Its combination of live tracking, environmental information, object-following controls, customizable visual styles, and AI-powered voice interaction makes it stand out from conventional map applications.
The project is especially appealing to OSINT enthusiasts, developers, geography enthusiasts, and anyone interested in exploring public real-world data. Its modular architecture and open-source license also make it a promising foundation for experimentation and customization.
However, users should understand the difference between live observations, estimates, and simulations. The application presents a unified picture of the world, but its usefulness depends on the quality and availability of the underlying data. Some of its most advanced features also require external credentials and additional setup.
God's Eye View is an excellent choice for interactive geospatial exploration and public-data visualization. It combines an ambitious feature set with an accessible installation path, while remaining extensible for developers who want to build on it.